BTC+2.1%ETH+1.4%SOL+4.8%INJ+3.1%ARB-0.6%TIA+0.9%SUI+2.7%LINK+1.8%RNDR+3.6%AVAX+2.2%DOGE+0.4%SEI-1.2%BTC+2.1%ETH+1.4%SOL+4.8%INJ+3.1%ARB-0.6%TIA+0.9%SUI+2.7%LINK+1.8%RNDR+3.6%AVAX+2.2%DOGE+0.4%SEI-1.2%

Strategy Optimizer

What Your Strategy Optimizer Report Includes

See how TradingEdgeIQ tests a grid of candidate parameter configurations, holds a portion of trades out for walk-forward validation, and surfaces which configuration is worth pursuing further — and which is just noise. Built from a synthetic sample dataset so nothing here is a real user's data, but every page, chart, and table is the actual generator output, not a mockup.
Executive Summary — sample report sectionGrid Results — sample report sectionTrade Retention — sample report sectionWalk-Forward Robustness — sample report sectionPareto Front — sample report sectionSensitivity & Parameter Zones — sample report sectionRecommended Next Tests — sample report sectionMethodology & Run Lineage — sample report section

Section 1 of 8

Executive Summary

Explore every section

Click any card to open that exact page of the real sample PDF.

Executive Summary thumbnail

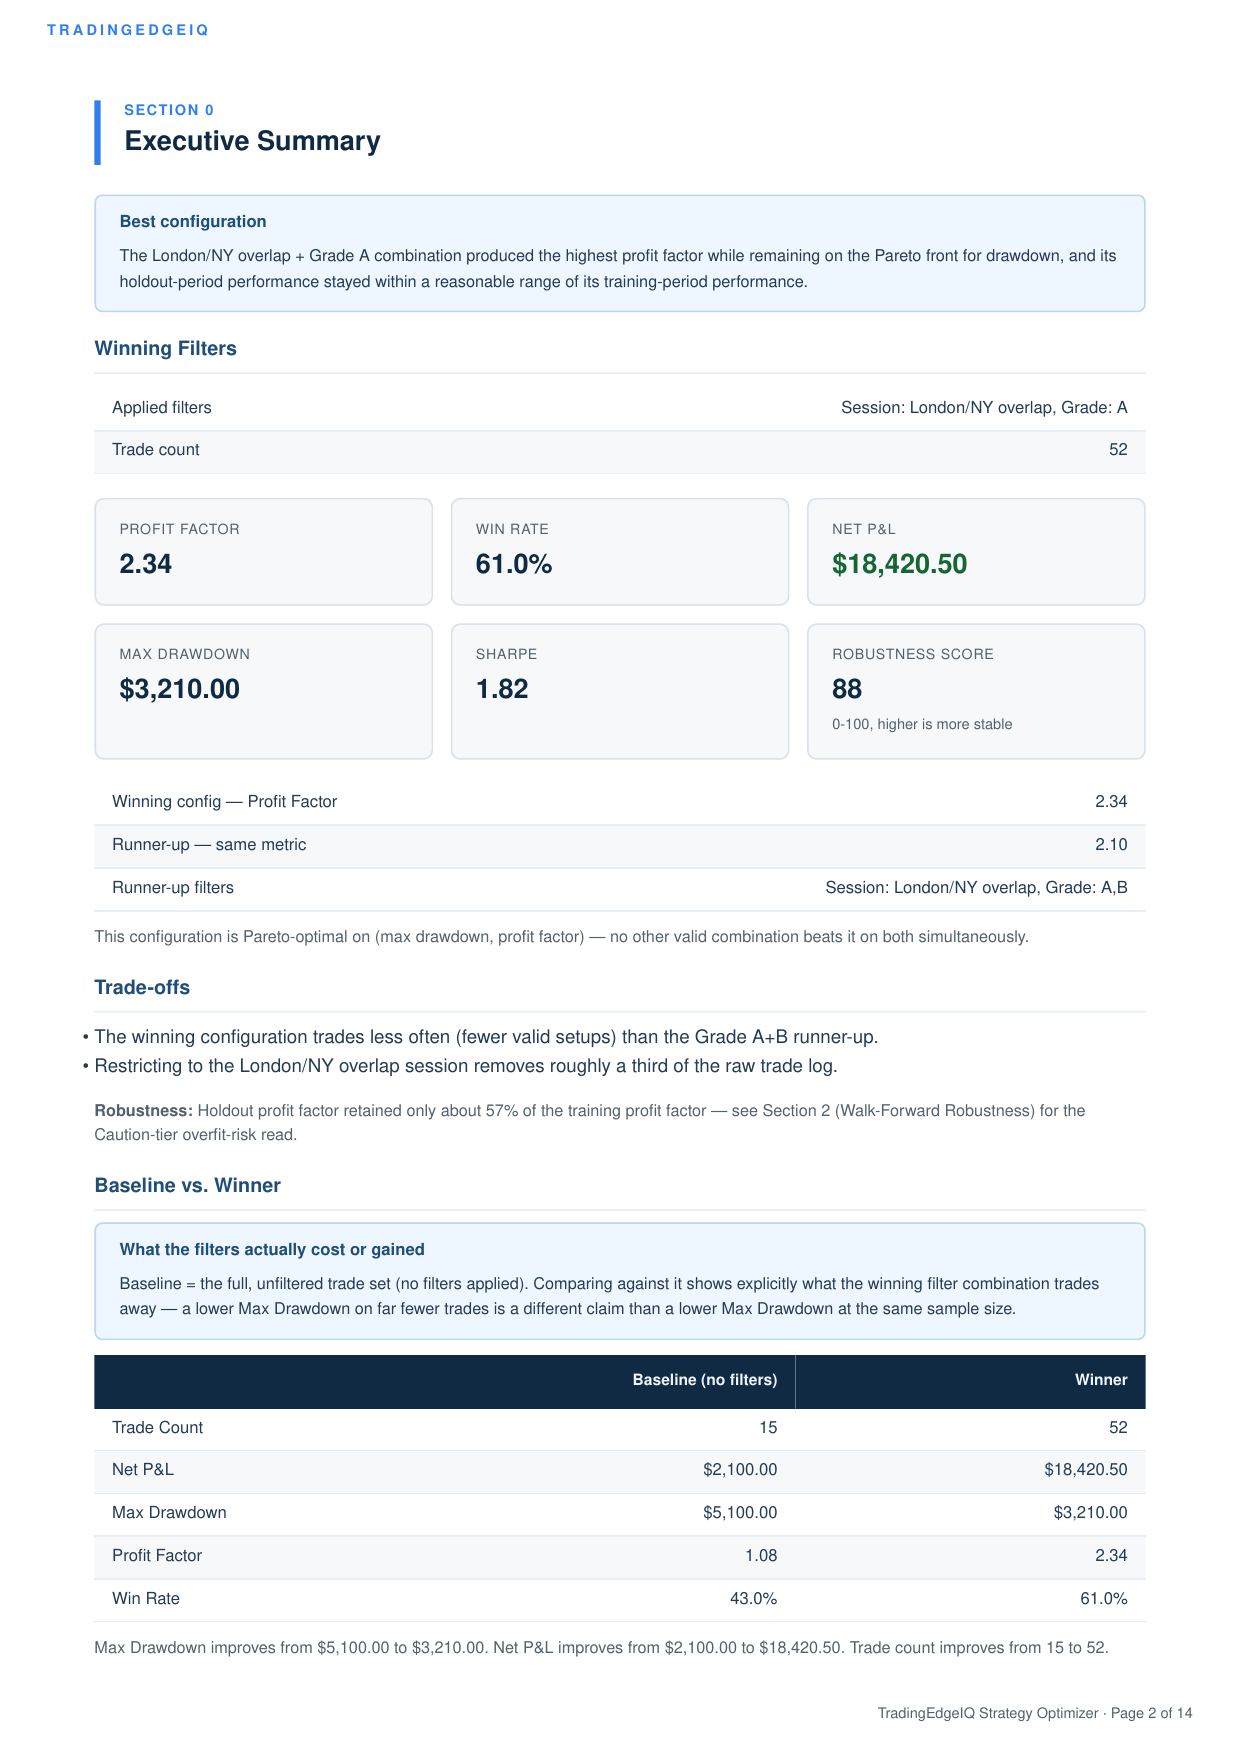
Executive Summary

The winning configuration, its net P&L and drawdown versus baseline, and a holdout robustness read.

View section →
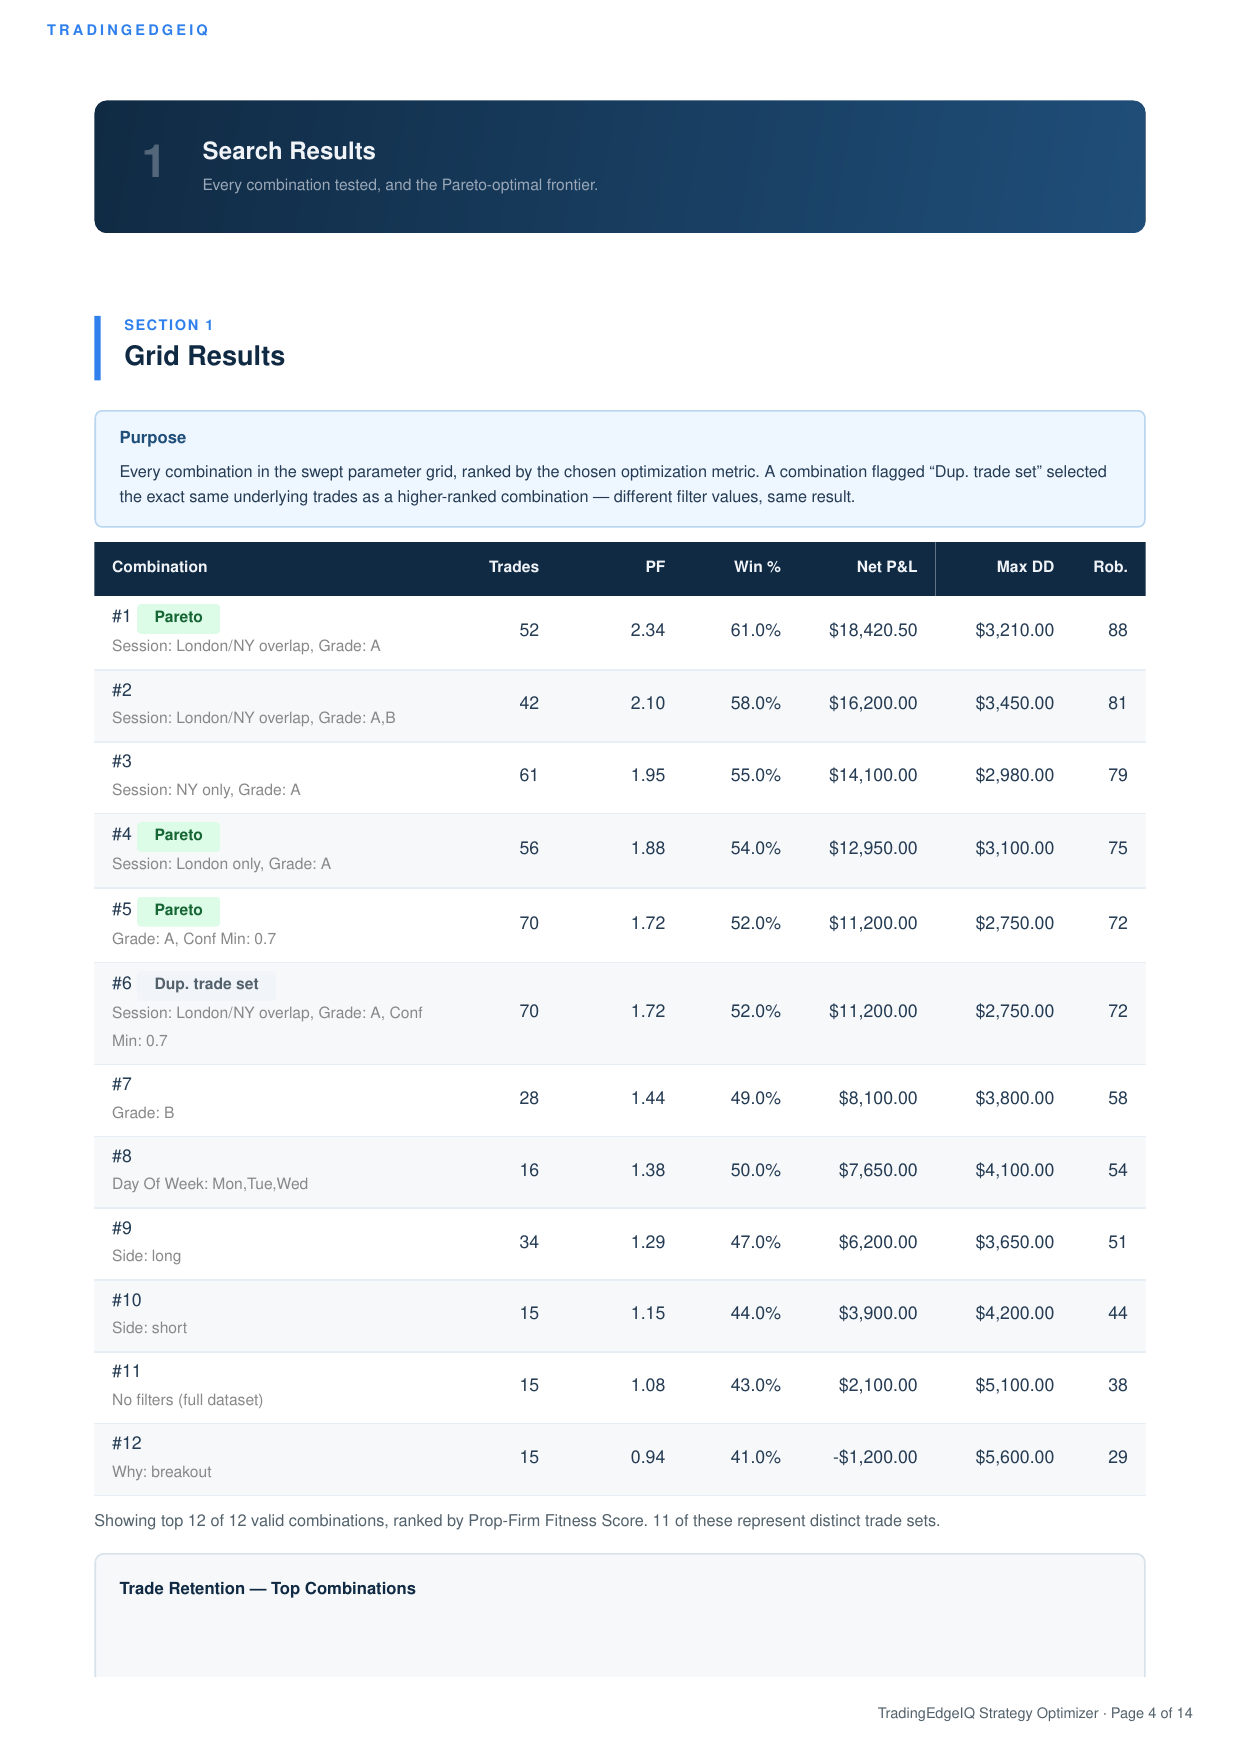
Grid Results thumbnail

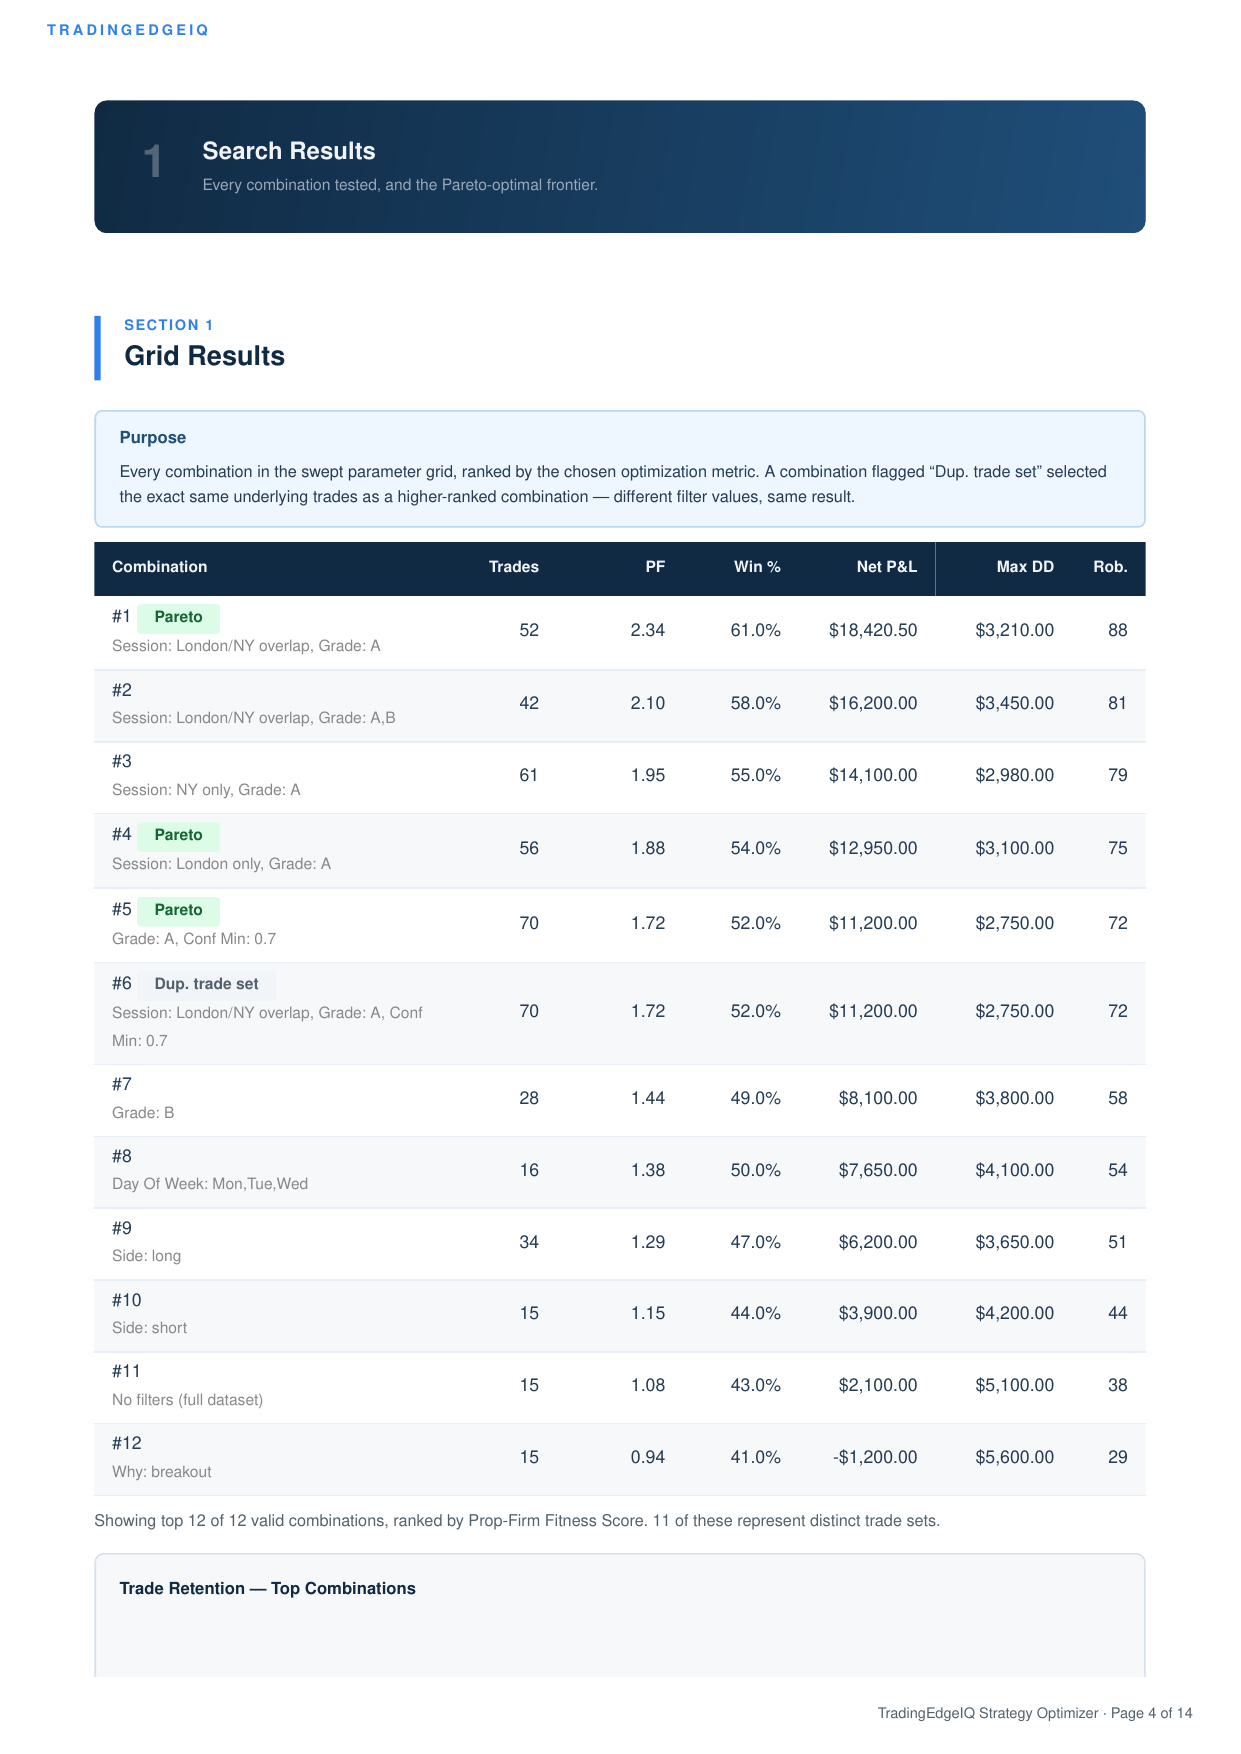
Grid Results

Every parameter combination tested, ranked by your chosen optimization metric.

View section →
Trade Retention thumbnail

Trade Retention

How many trades survive each filter combination — so a top result with too few trades gets caught.

View section →
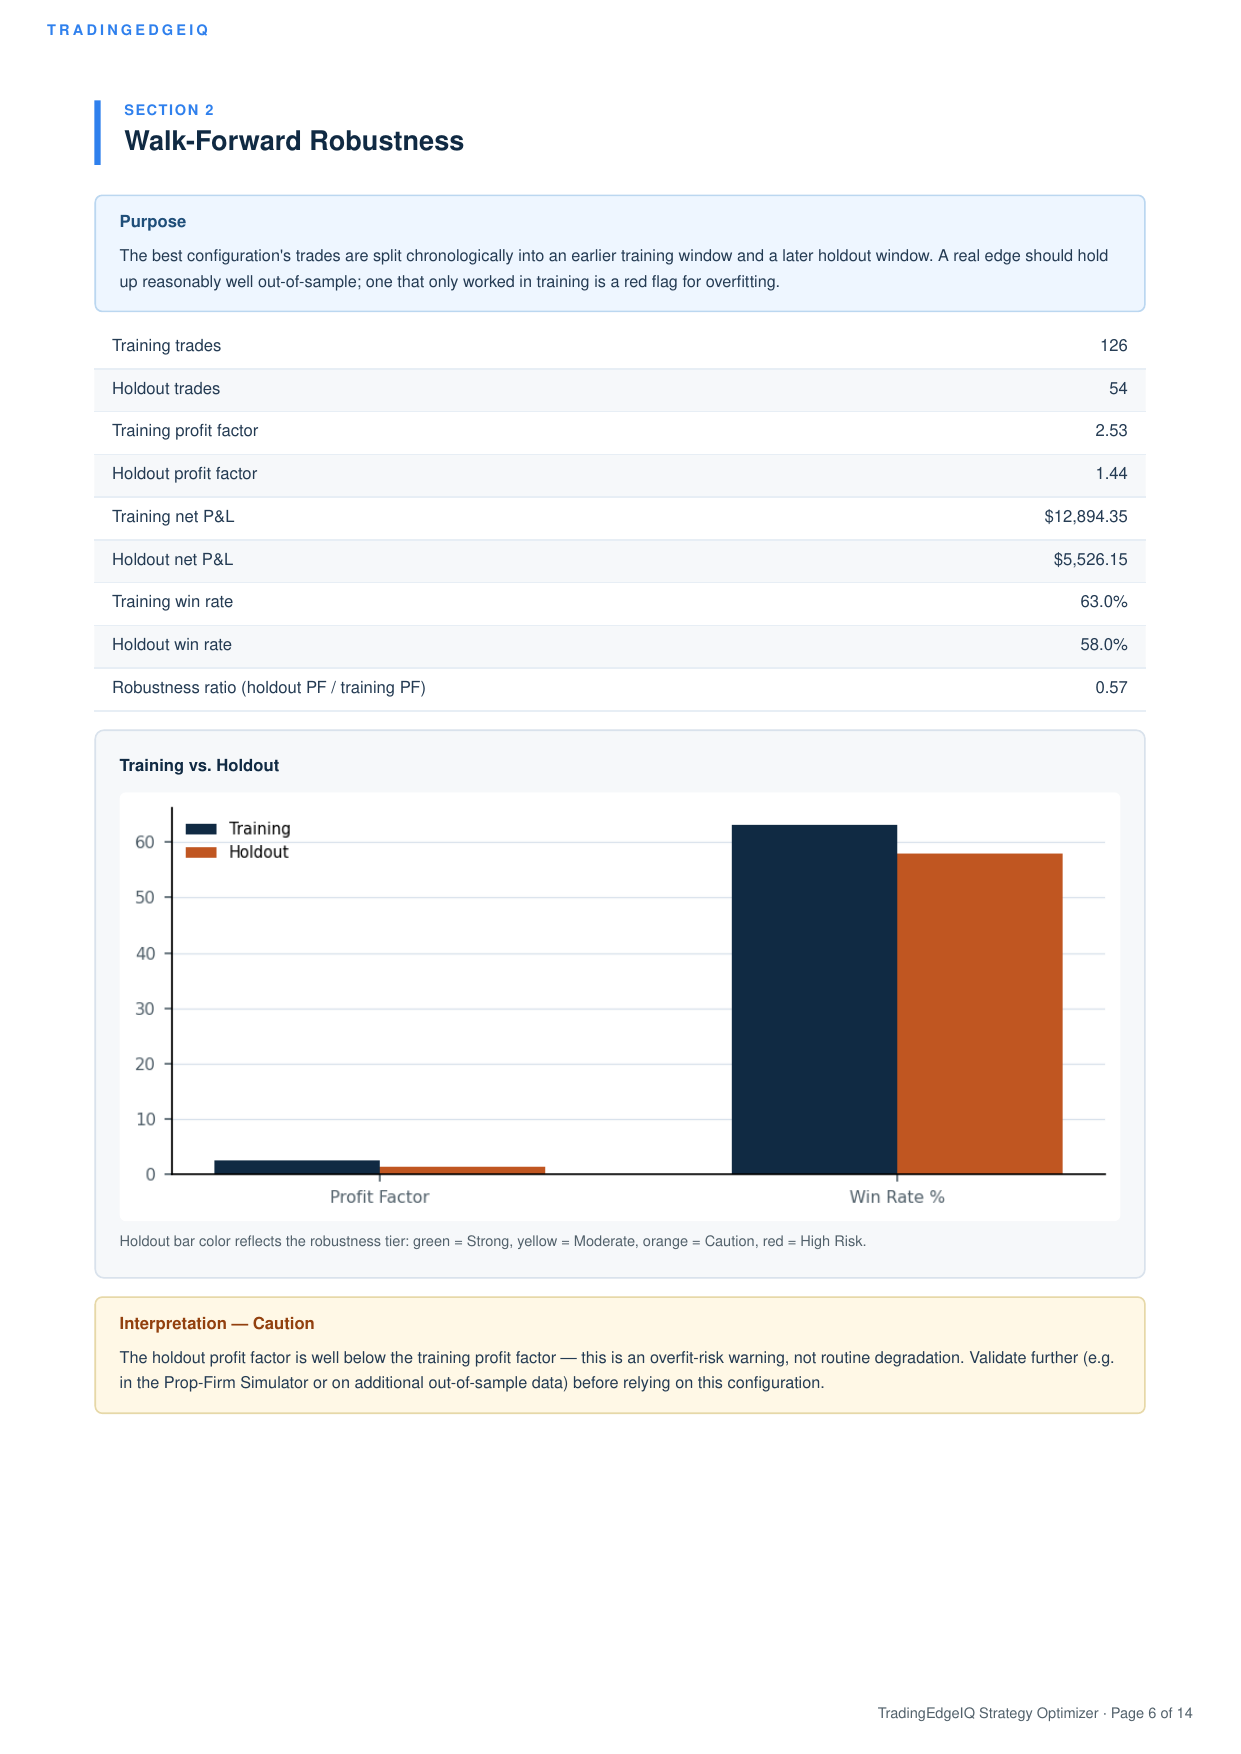
Walk-Forward Robustness thumbnail

Walk-Forward Robustness

Training-window performance versus out-of-sample holdout performance, with an overfitting-risk read.

View section →
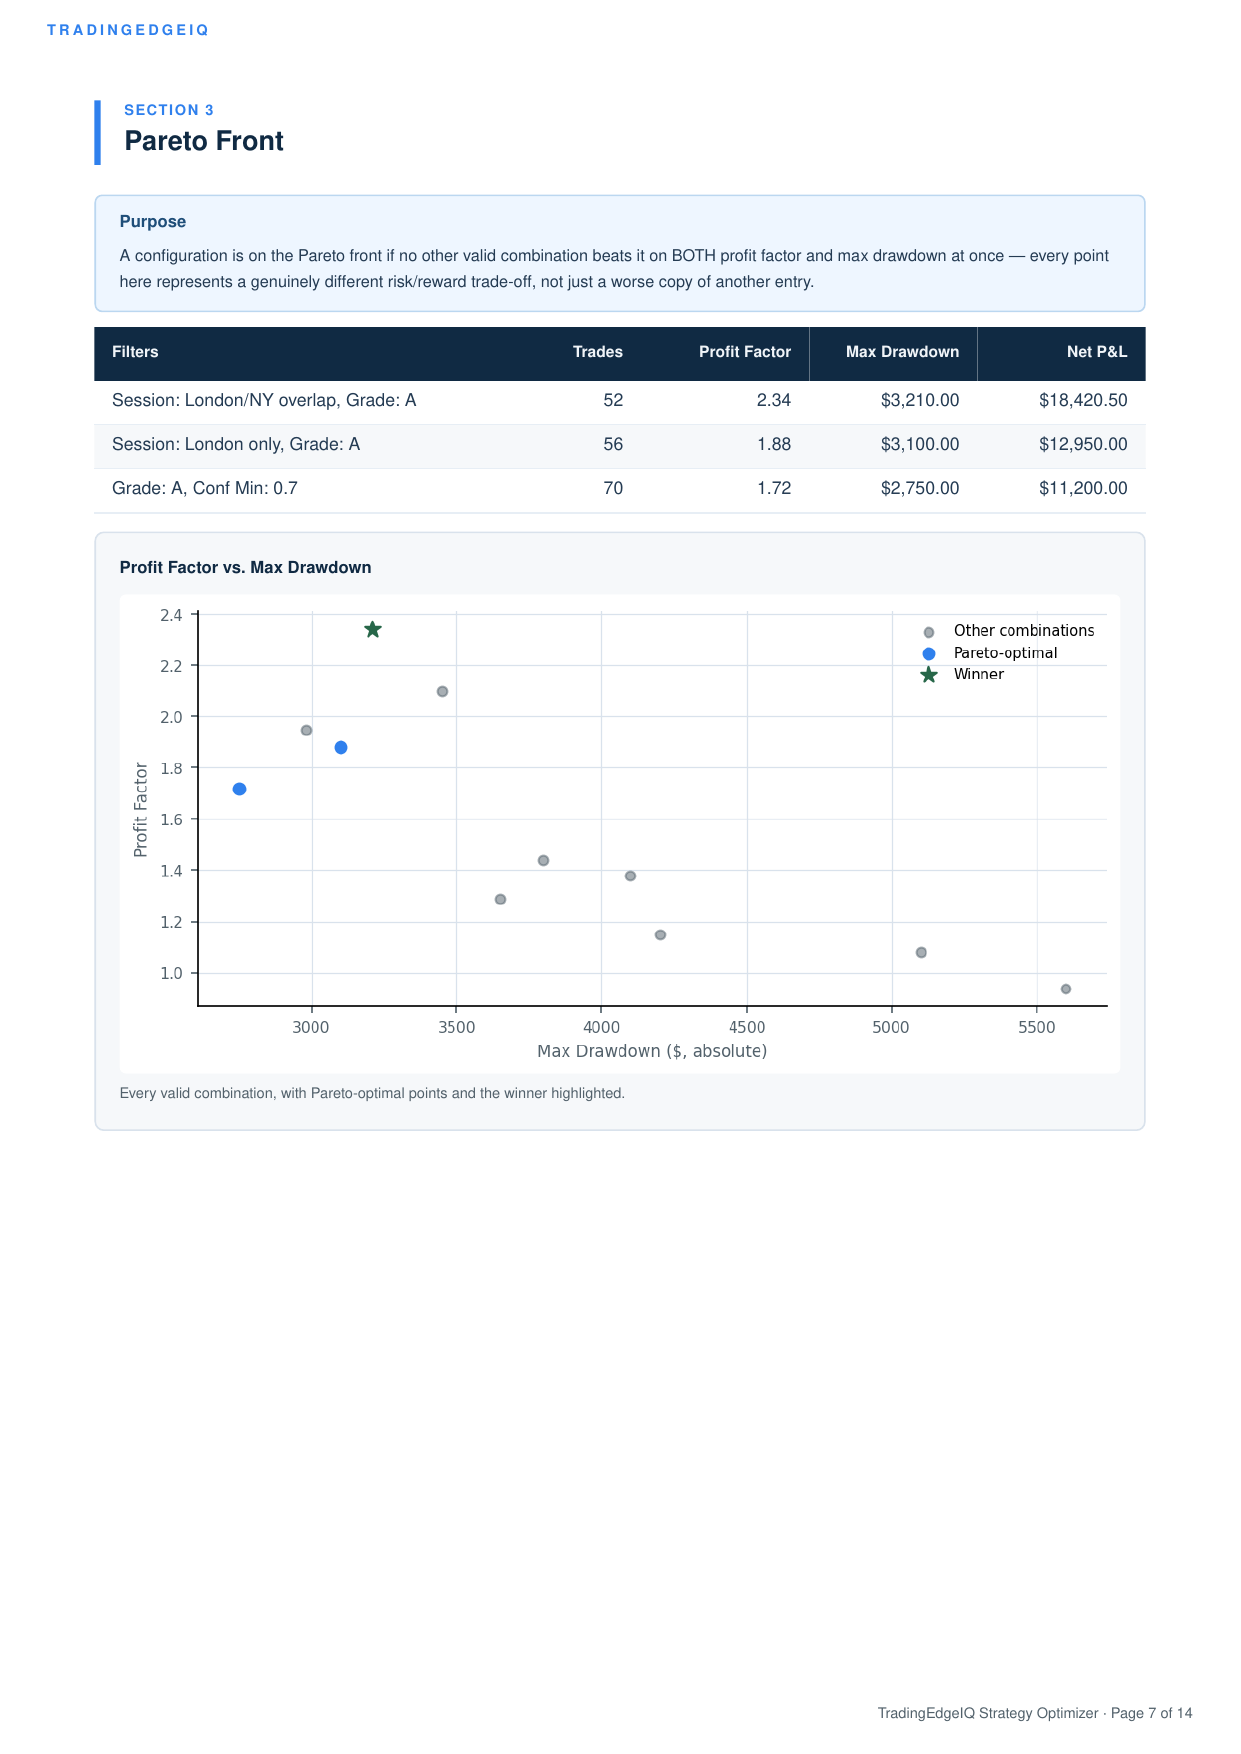
Pareto Front thumbnail

Pareto Front

The trade-off frontier between profit factor and max drawdown across all tested combinations.

View section →
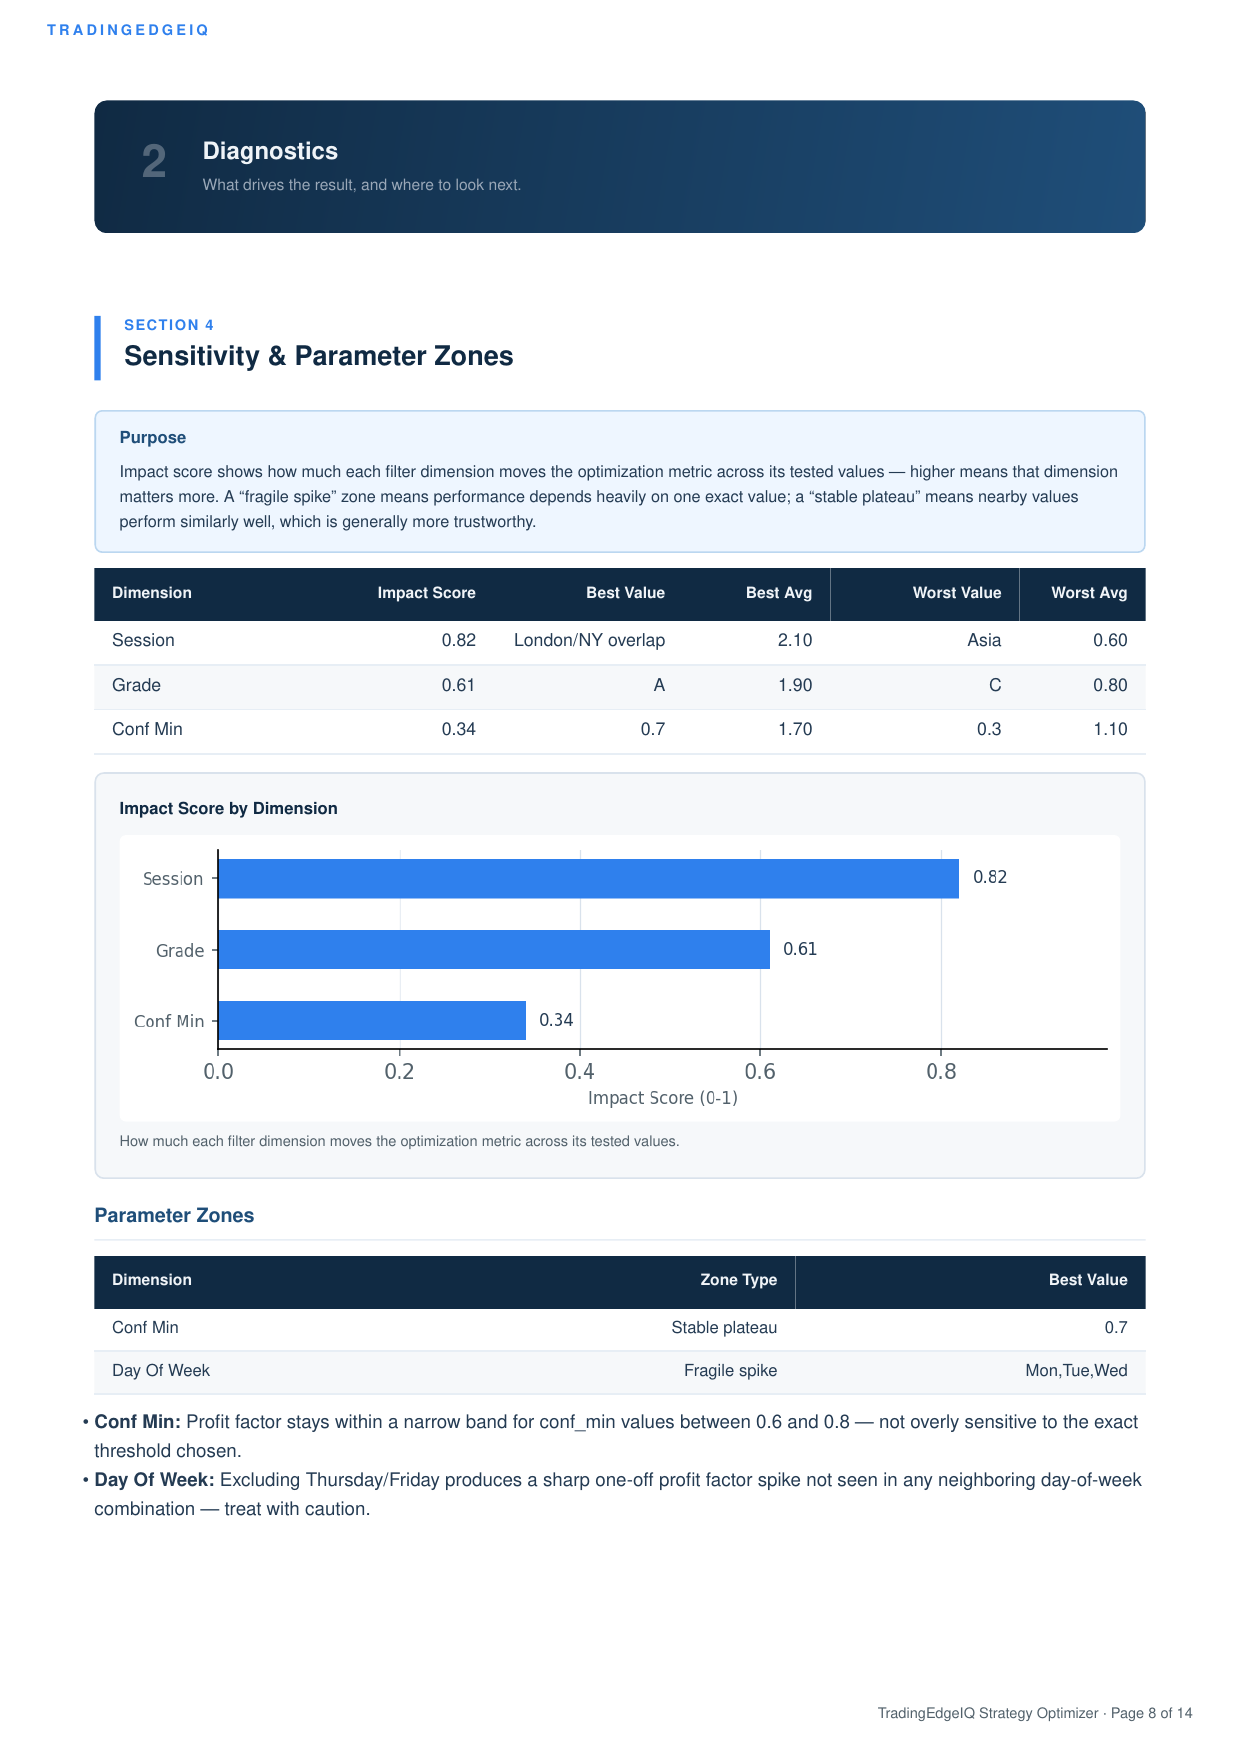
Sensitivity & Parameter Zones thumbnail

Sensitivity & Parameter Zones

Which parameters actually move the outcome, and which ranges are stable versus fragile.

View section →
Recommended Next Tests thumbnail

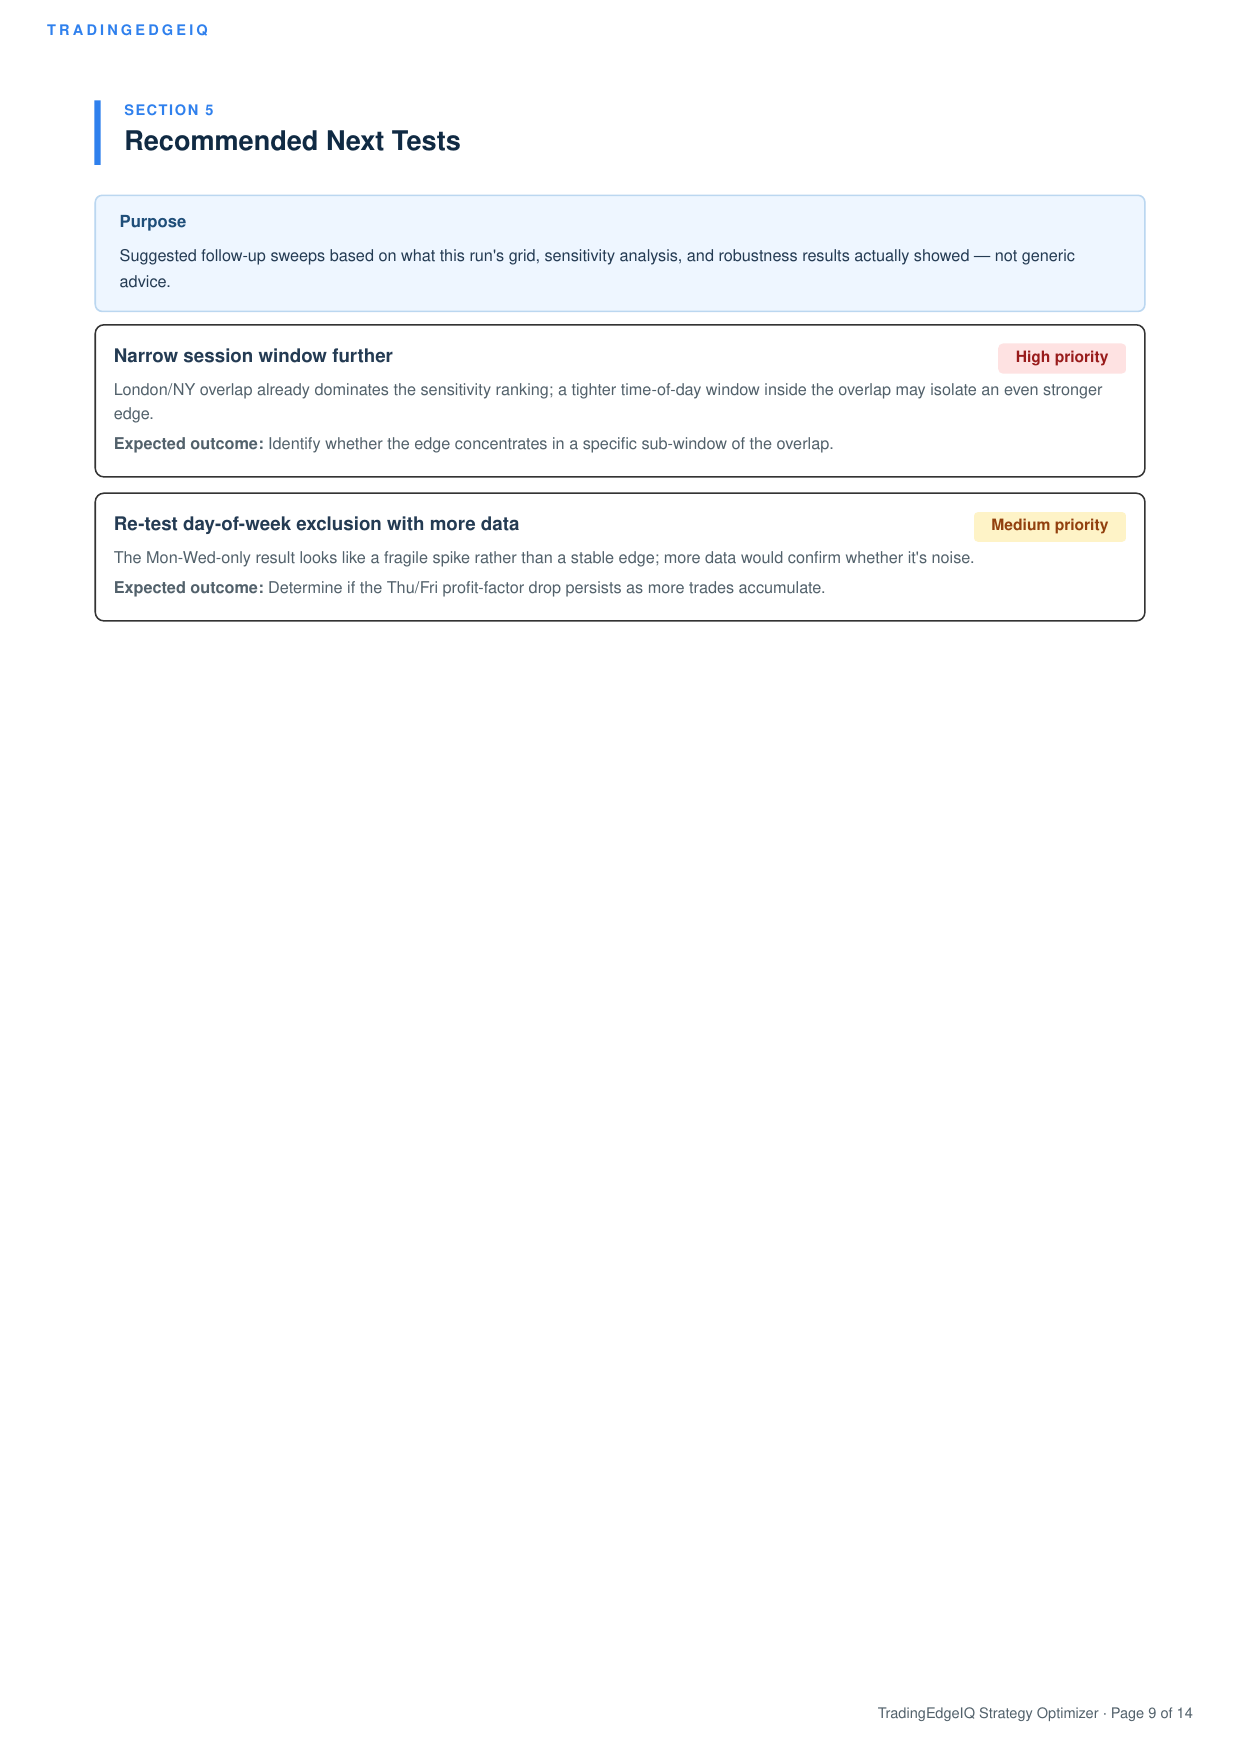
Recommended Next Tests

Specific follow-up tests to run next, tied to holdout robustness, trade retention, and net P&L.

View section →
Methodology & Run Lineage thumbnail

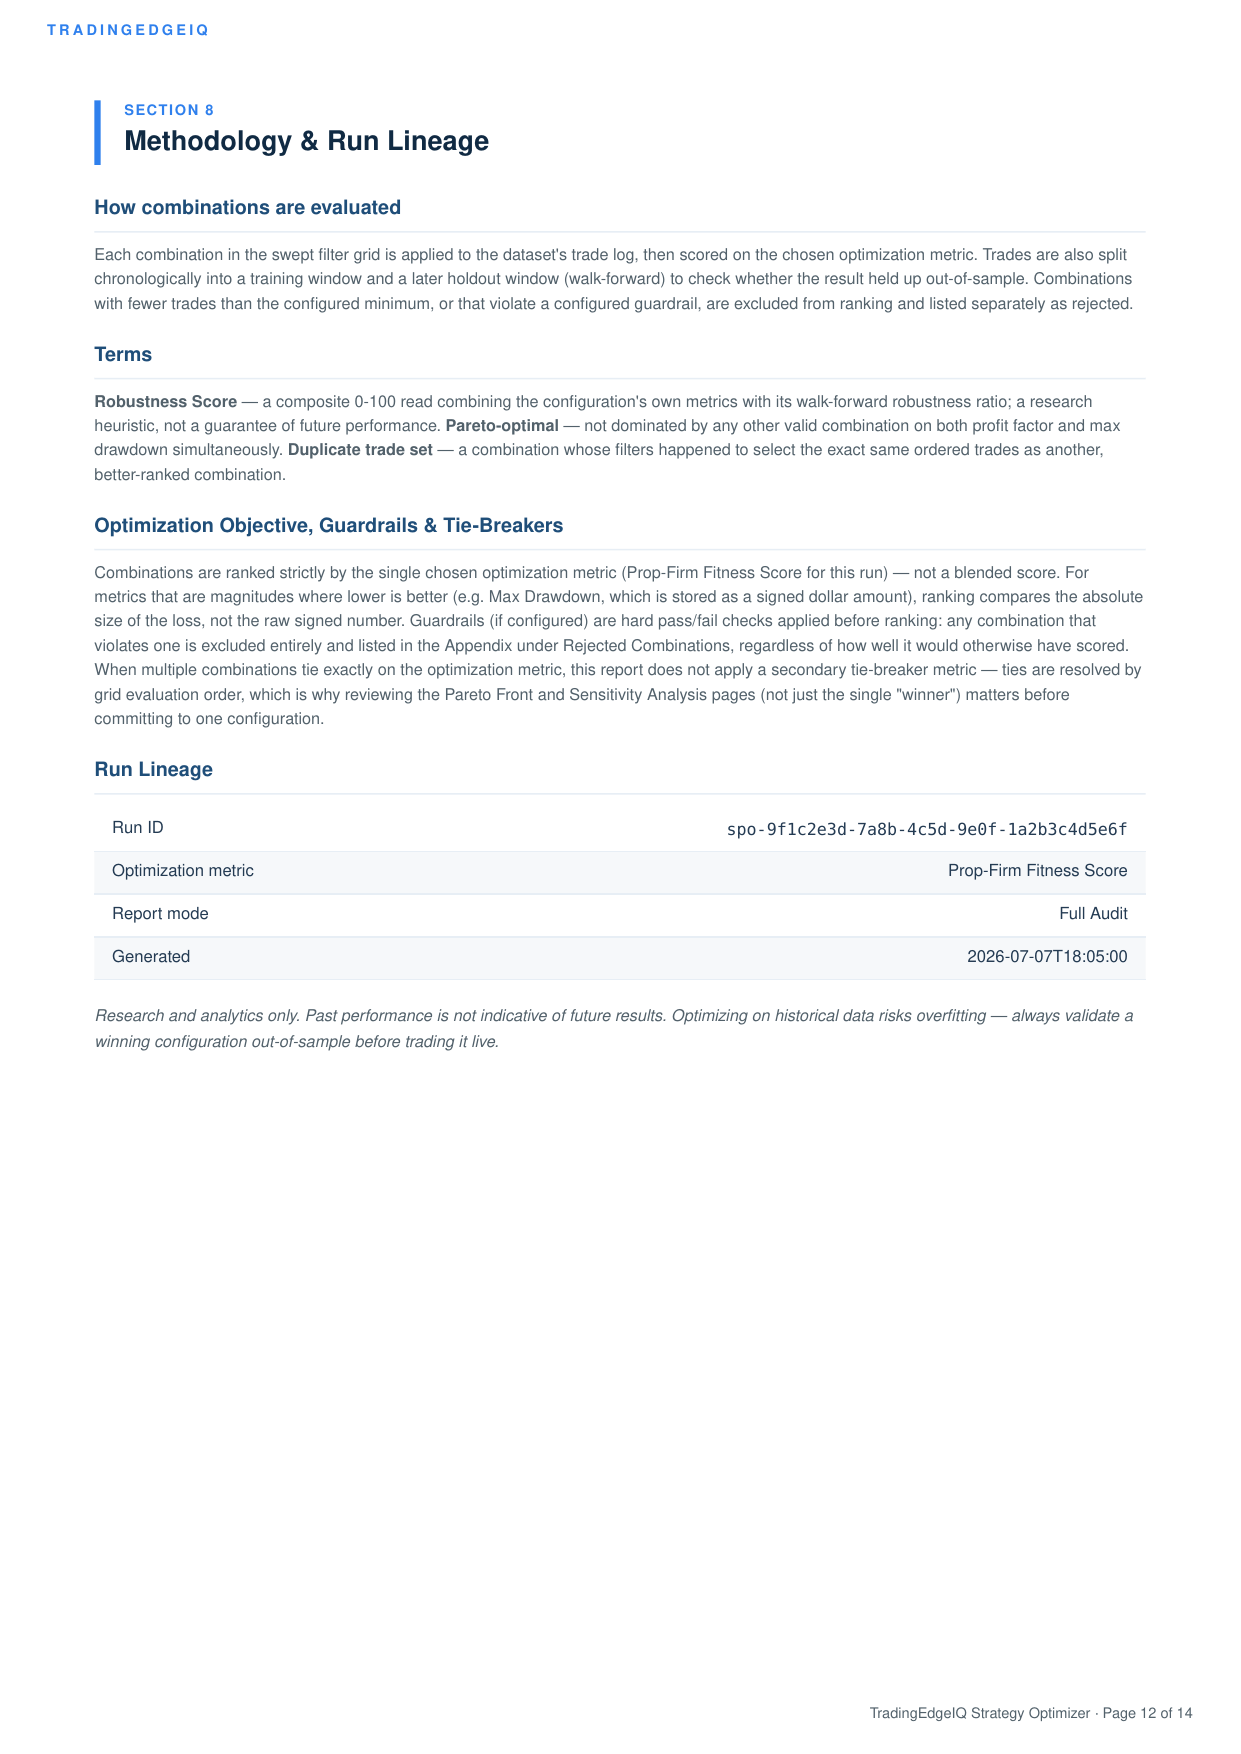
Methodology & Run Lineage

How the grid search and walk-forward split were constructed, plus this run's exact identifiers.

View section →

Get the full sample report

View Full Audit Sample ReportDownload Sample PDF

Built from a synthetic historical trade distribution and a candidate parameter grid · Backtest optimization only, not a guarantee of future performance · Research and analytics only

Optimize Your Own Strategy

Bring a Strategy Analyzer run or your own trade data, define the parameter grid you want to test, and see which candidate configuration actually holds up out-of-sample.

← Back to Strategy Optimizer